Cyber Risk Quantification Explained: Methods, Tools, and Business Impact

Robin Joseph
Senior Security Consultant

You know those security reports filled with red, yellow, and green traffic lights? The ones that scream “CRITICAL RISK” but never explain what that means for your bottom line?
That’s the problem. Most organizations are flying blind on cyber risk. They’re making million-dollar decisions based on gut instinct, color-coded charts, and opinions instead of hard evidence. It may look convincing in a slide deck, but when it comes to business impact, those traffic lights don’t translate into dollars and cents.
That’s where Cyber Risk Quantification (CRQ) comes in.
Instead of vague “high,” “medium,” or “low” ratings, CRQ gives leaders what they need: real numbers. Dollar amounts. Probabilities. The kind of financial language that makes sense in boardrooms and budget meetings.
The gap is striking. Only 15% of organizations measure cyber risk in a meaningful way. That means 85% are running programs without knowing what threats actually cost—like operating a business without knowing profit margins.
This blind spot costs millions in wasted spending, poor priorities, and overlooked risks. CRQ closes that gap by putting cyber risk in financial terms, so decisions are finally grounded in data, not drama.
What is Cyber Risk Quantification and Why It Matters
At its core, Cyber Risk Quantification (CRQ) assigns real financial values to cyber threats. Instead of abstract labels like “critical” or “high,” you get something far more tangible—such as “ransomware risk equals $2.3 million potential annual loss.” Suddenly, everyone in the organization, from security teams to executives, is speaking the same language.
This shift changes how decisions are made. With CRQ, you can:
- Make decisions based on data, not drama
- Show executives exactly how cyber incidents will impact revenue and profits
- Stop prioritizing projects based on who shouts loudest
- Align your cybersecurity budget directly with business goals
Traditional risk assessments rely heavily on judgment calls and subjective ratings. CRQ replaces this with probabilities and loss magnitude, calculating exposure in clear financial terms. That makes it possible to evaluate different security investments side by side, compare outcomes, and demonstrate measurable return on investment.
Frameworks like the FAIR (Factor Analysis of Information Risk) model lead the way. FAIR defines risk as “the probable frequency and probable magnitude of future loss” and translates technical risk into financial impact. The goal isn’t perfect precision—it’s enabling better, more defensible decision-making.
Core Cyber Risk Quantification Methods Explained
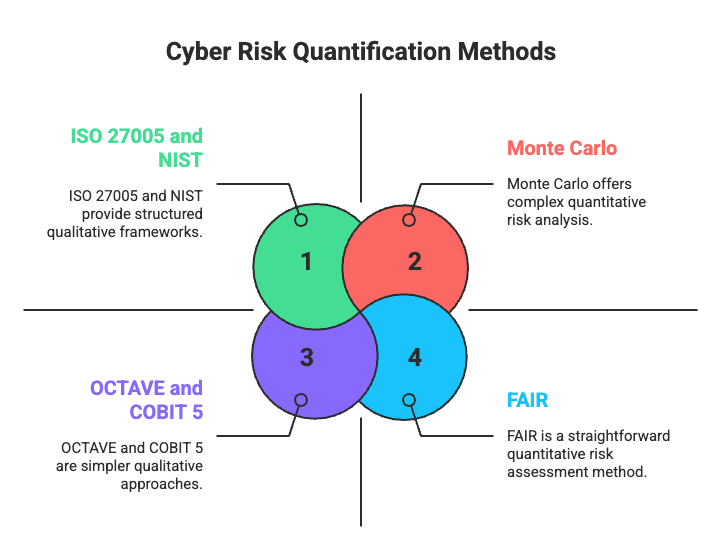
There are several proven frameworks for putting numbers on digital risk. Each takes a different approach, but all solve the same problem: turning scary-sounding threats into concrete business numbers. These are the methods that actually matter for quantifying cyber risk:
- FAIR
- Monte Carlo
- ISO 27005 and NIST
- OCTAVE and COBIT 5
Let’s get into each of these methods in detail.
1. FAIR: The International Standard That Actually Works
The Factor Analysis of Information Risk (FAIR) is the only international standard quantitative model for information security and operational risk. FAIR keeps it simple:
- Loss Event Frequency (LEF): How often something happens
- Loss Magnitude (LM): How much it costs when it does
Losses are split into primary losses (direct hits like server repairs) and secondary losses (fines, legal costs, reputation damage). The Open Group has made FAIR the official Value at Risk (VaR) model for cybersecurity—global standard territory.
2. Monte Carlo: Mapping Every Possible Outcome
Monte Carlo simulation runs thousands of “what if” scenarios to calculate Annual Loss Expectancy (ALE)—what you can expect to lose in a year.
How it works:
- Takes random samples from your data
- Runs thousands of scenarios
- Shows probabilities for each outcome
Instead of one static number, you see ranges: “20% chance of losing under $100K, 5% chance of losing over $1M.” Most simulations run 1,000+ iterations for reliable results.
3. ISO 27005 and NIST: Government-Backed Guidance
ISO 27005 provides guidelines for information security risk assessments that work with ISO 27001. It doesn’t prescribe methods but gives a structured process: establish context, assess, treat, and monitor.
NIST SP 800-53, from the U.S. National Institute of Standards and Technology, evaluates whether your controls actually work. It explicitly includes ALE as a method to estimate annual financial impacts—executive-friendly and compliance-approved.
4. OCTAVE and COBIT 5: Enterprise-Level Governance
OCTAVE focuses on where information lives, moves, and gets processed, analyzing risk in real operational context. COBIT 5, from ISACA, helps organizations connect IT risk directly to business impact.
These aren’t replacements for quantitative methods like FAIR or Monte Carlo. They provide governance structure, ensuring risks are identified, assessed, and addressed systematically.
The beauty is you don’t need to pick one. Many organizations combine them, building a complete risk picture that makes sense to both technical teams and business leaders.
How to Apply Risk Quantification Models in Practice
Enough theory. Let’s get into the calculations—the formulas that turn “we might get hacked” into “this could cost us $250,000.” These aren’t abstract numbers to impress your boss. They’re the foundation of every sound security decision.
Single Loss Expectancy (SLE): What One Bad Day Costs
SLE asks a simple question: If this threat hits once, how much money do we lose?
Formula:
SLE = Asset Value × Exposure Factor
Examples:
- Server valued at $50,000 with 30% exposure = $15,000
- Database worth $100,000 with 25% exposure = $25,000
The tricky part is estimating the exposure factor—the percentage of an asset’s value lost in an incident. A stolen laptop with unencrypted customer data? That’s not just lost hardware. That’s 100% exposure and a regulatory nightmare.
Annual Rate of Occurrence (ARO): How Often It Hits
Next is frequency: how often does the threat show up?
Formula:
ARO = Number of Incidents ÷ Years
Examples:
- Ransomware every 4 years = 0.25
- Service outages 5 times per year = 5
Where do you get these numbers? Your own incident history, industry breach reports, threat intelligence feeds, and expert analysis. Pro tip: don’t guess—bad ARO numbers make everything else worthless.
Annual Loss Expectancy (ALE): The Number That Matters
This is where SLE and ARO come together to show the real annual cost.
Formula:
ALE = SLE × ARO
Example: A $500,000 customer database hit with 50% impact = $250,000 SLE. If ransomware strikes once every four years (ARO = 0.25), the ALE is $62,500 annually.
Here’s where budgeting gets real: If $8,000 a year in monitoring reduces the ARO from 0.25 to 0.1, you’ve cut expected losses by $29,500. That’s measurable ROI.
Proving Your Controls Work
Controls change the math. They:
- Shrink exposure by limiting damage
- Lower frequency by stopping more attacks
- Drive down ALE
The FAIR model makes this explicit. Better controls = lower losses. That’s how you prove security isn’t just cost—it’s profit protection.
The math doesn’t lie. Your gut might.
Top Cyber Risk Quantification Tools in 2024
You can have the best risk quantification framework in the world, but if you’re still stuck in spreadsheets and PowerPoint, you’re missing the point. The right tools don’t just crunch numbers—they make risk quantification usable across the business. Here’s what’s worth your time in 2024:
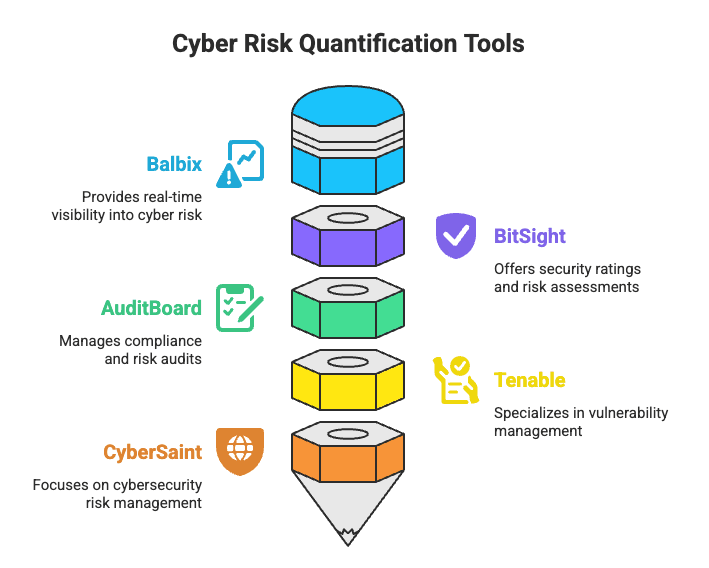
- Balbix
- BitSight
- AuditBoard
- Tenable
- CyberSaint
Let’s go into each tool and see what makes them stand out.
1. Balbix: When AI Meets Real Risk Numbers
Balbix nails what others miss. Instead of dumping dashboards, it calculates financial risk across every asset in real time—using exposure, exploitability, and business impact data. Results translate into dollar figures the board actually understands. With AI-driven automation, manual modeling disappears. One CISO even cut cyber insurance premiums by 25% with Balbix.
2. BitSight: Risk Quantification Executives Understand
BitSight was built for business leaders. It delivers quick, repeatable financial exposure assessments with scenario-based modeling for threats like ransomware. On-demand reports are board-ready without translation. By combining technographic, firmographic, and insurance claims data, BitSight deploys fast—no six-month rollout.
3. AuditBoard: Risk That Stays Current
Most platforms show last quarter’s picture. AuditBoard shows today’s. Its dashboard covers compliance activities, real-time KPIs, and even SEC disclosure prep for 8-K and 10-K filings. Analytics highlight risk trends before they escalate, helping teams act early instead of react late.
4. Tenable: Cutting Through Vulnerability Noise
Organizations drown in thousands of vulnerabilities, but only a handful matter. Tenable’s Vulnerability Priority Rating (VPR) pinpoints the critical 1.6% using AI-powered scoring tied to the latest threat intel. The result: up to 90% fewer remediation tasks. No more chasing alerts that don’t matter.
5. CyberSaint: Automated Compliance That Scales
CyberSaint streamlines risk quantification with automated compliance and risk assessments that adapt as your security data changes. Real-time tracking spans multiple frameworks, and dashboards adjust to your risk posture. Fortune 500s have reported saving millions annually with the platform.
The truth? You don’t need all five tools. Pick the one that matches your maturity and addresses your pain points. But whatever you do, stop quantifying risk in Excel. Your business deserves better.
Business Impact of Cyber Risk Quantification
Choosing a cyber risk quantification (CRQ) platform is like online dating—everyone looks flawless in the demo, but not all will deliver when it counts. Pick the wrong one and you’ll waste budget, frustrate your team, and still walk into board meetings with no clear sense of risk. Pick the right one and you finally cut through the noise, turning vague numbers into decisions executives actually understand.
Know What You Actually Need
Don’t get fooled by glossy dashboards. Get clear on what matters:
-
Which risks haunt you most—outside hackers, fragile supply chains, insider screwups?
-
How big and mature is your program? Enterprises may need advanced modeling; smaller teams need clarity and speed.
-
Which regulations define your reality, and how much risk are you truly willing to carry?
Risk appetite isn’t universal. Some platforms understate exposure; others exaggerate it. Choose one that mirrors your tolerance—not the vendor’s sales pitch.
Will Your Team Actually Use It?
The best platform fails if it gathers dust. Look for:
- Interfaces anyone can navigate in days, not months
- Dashboards that scream when something’s wrong, not bury signals in jargon
- Consistent scoring so your entire team speaks the same risk language
Does It Play Nice with Your Stack?
Integration disasters sink projects quickly. Your CRQ tool must:
- Connect seamlessly with SIEM, endpoint, and compliance tools
- Break down data silos instead of creating new ones
- Refresh fast enough to reflect today’s threats, not last quarter’s
See It in Action—With Your Data
Never trust a vendor slide deck. Run trials in your environment. Compare platforms side by side. Check if both engineers and execs can make sense of the outputs. Confirm it scales with your growth.
Bottom line: skip the pretty charts that don’t matter. The right CRQ platform replaces guesswork with intelligence that drives real outcomes.
Best Practices for Implementing Risk Quantification
Here’s the deal: you can have the sharpest risk quantification theory in the world, but if execution fails, you’re just burning money on spreadsheets that never translate into real business impact.
Too many organizations try to boil the ocean on day one—quantifying every single risk across every department, hoping to show maturity fast. Spoiler: that approach always fails. The result? Teams burned out, leaders frustrated, and nothing meaningful to show.
Start Small. Win Big.
Resist the urge to quantify everything at once. Begin with high-value scenarios that actually move the needle:
- Immediate pain points tied directly to business outcomes
- Key processes in your value chain that drive revenue or reputation
- Problems too complex to solve without quantification
Pick one use case. Maybe it’s ransomware targeting customer data. Maybe it’s supply chain fragility in manufacturing. Nail that first. Prove measurable results. Build confidence. Then expand gradually.
Get Everyone Speaking the Same Language
If your CFO says “risk” and your CISO says “risk,” they should mean the same thing. Otherwise, you’re having two conversations that never align. Build clarity by:
- Defining risk as “the potential for loss obstructing business objectives”
- Standardizing terminology across every department
- Summarizing uncertainty sources—environment, process, and information
Shared vocabulary ensures decisions don’t get lost in translation.
Stop Doing Everything Manually
Manual assessments collapse under scale. Instead:
- Integrate with SIEM, vulnerability scanners, and compliance tools
- Use AI-driven automation to refresh threat frequencies in real time
- Pull external intelligence directly into your models
If you’re still updating registers by hand, you’re already behind.
Keep Your Data Fresh
Yesterday’s risk assessment? As useful as yesterday’s weather forecast. Stay relevant by:
- Quarterly reviews for high-impact areas, semiannual for others
- Continuous monitoring through automation
- Reassessing after breaches, mergers, or new regulations
Risk quantification succeeds only with discipline. No shortcuts. No exceptions.
Building a Resilient Cyber Risk Strategy
Prevention isn’t enough anymore.
Not when malicious emails jumped 600% during the pandemic. Not when cybercrime is expected to cost $10.5 trillion annually by 2025.
The hard truth? Your organization will face incidents. The real question isn’t if—it’s how well you’ll bounce back.
That’s the essence of cyber resilience. Unlike the “build higher walls” approach, resilience assumes threats will get in and prepares you to respond:
Preparedness: Plan for threats, don’t just hope.
Detection: Spot issues early.
Response: Maintain a tested plan, not a binder gathering dust.
Recovery: Restore operations fast.
Adaptation: Learn and improve.
Organizations linking risk quantification with resilience see stronger outcomes. PwC found that companies integrating cyber risk into business planning suffer far less financial damage. It makes sense—when you understand what risks actually cost, preparation becomes smarter and more targeted.
Resilience isn’t complicated, but it requires discipline: map assets and their value, monitor threats continuously, test defenses more than once a year, and clearly document response roles.
It isn’t a one-time project—it’s an ongoing commitment. The goal isn’t perfection. It’s being ready for whatever comes next.
Take control of compliance, reduce risk, and build trust with UprootSecurity — where GRC becomes the bridge between checklists and real breach prevention. → Book a demo today